How to monitor SOAP Messages using TCP/IP Monitor in Eclipse
- Details
- Written by Nam Ha Minh
- Last Updated on 21 December 2019 | Print Email
Background of the TCP/IP Monitor
Behind the scenes, the TCP/IP Monitor intercepts requests sent from the client at a specific port, and forwards them to the destination server at another port. So the monitor is able to capture the request and response in the middle (this technique is also called port forwarding). That means we need to change the server port at the client to the one at which the monitor is listening. The following diagram depicts the principles of the monitor: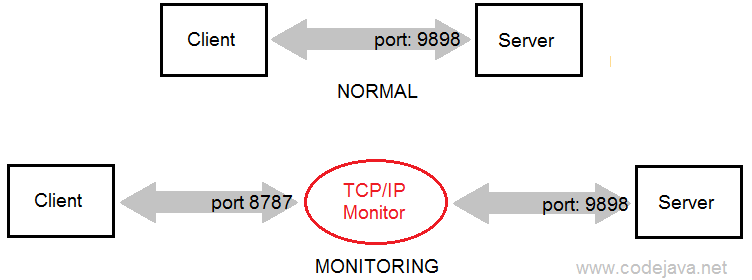
Setting Up a new TCP/IP Monitor in Eclipse
Assume that we already developed an application as described in the tutorial: Java Web Services Binary Data Transfer Example (base64 encoding), and the web service server is listening on the port number 9898. Now, we need to change the server port in the client code. Open the generated file FileTransfererImplService.java, and then replace all the port numbers 9898 to 8787. So the related URL looks like this:http://localhost:8787/codejava/fileService?wsdl
Click Window > Preferences from Eclipse’s main menu, then select Run/Debug > TCP/IP Monitor on the left side in the Preferences dialog: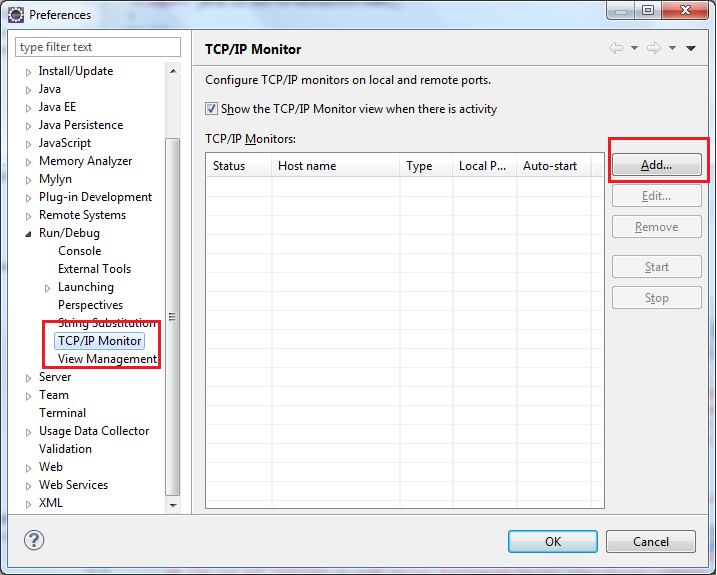 Click the Add button on the right, the New Monitor dialog appears. Enter the information as follows:
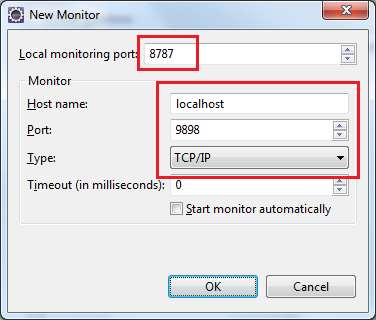
- Local monitoring port: 8787
- Host name: localhost
- Port: 9898
- Type: TCP/IP
 Click OK to close the Preferences dialog. Now, we need to show the TCP/IP Monitor view by going to Window > Show View > Other..., and select the TCP/IP Monitor from the list:
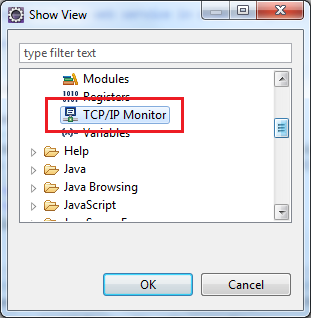 Click OK, the TCP/IP Monitor view gets displayed but there is no data because there isn’t any communications between the client the server:
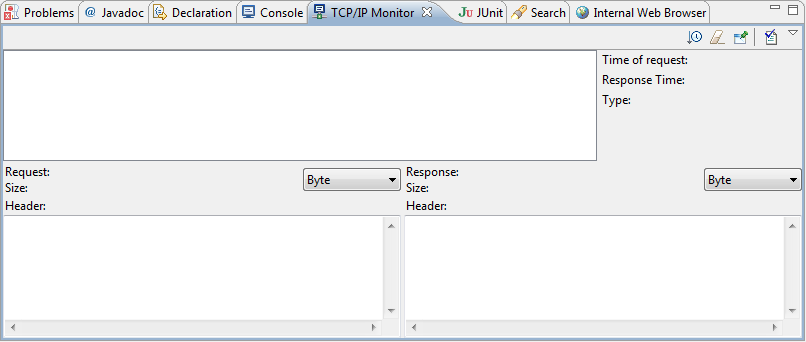 Let’s execute the client program (WebServiceClient.java), and we see the TCP/IP Monitor captured the request and response as shown in the following screenshot:
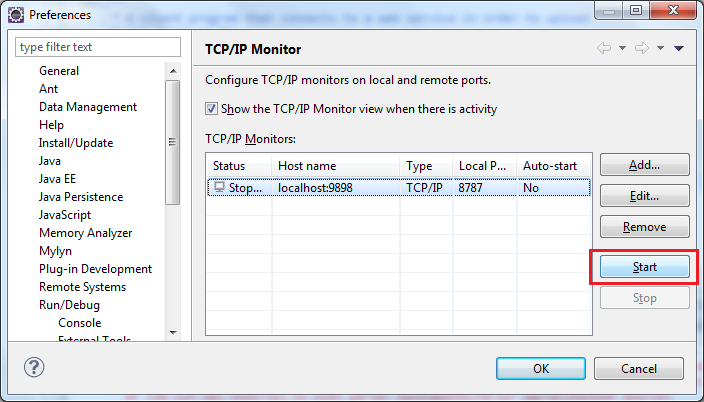
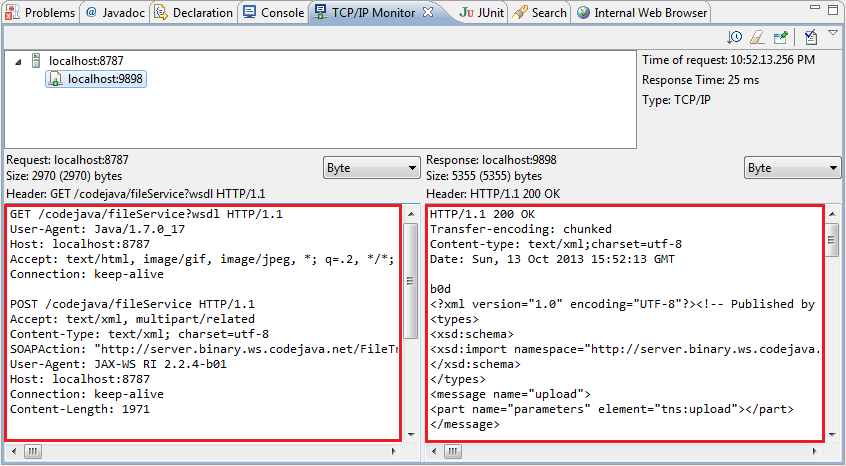 As we can see, the monitor shows the raw request and response in plain text format so that we can spot and analyze the SOAP messages sent from the client as well as returned from the server, along with other useful information. In addition, using this TCP/IP Monitor we can also modify the request, re-send the request and view the request/response in different views (Byte, Image, XML, Web browser). Let experiment these features yourself.To stop monitoring, re-visit the TCP/IP Monitor section in the Preferences dialog (or right click inside the TCP/IP Monitor view and select Properties). Then select the monitor you want to stop, and click Stop:
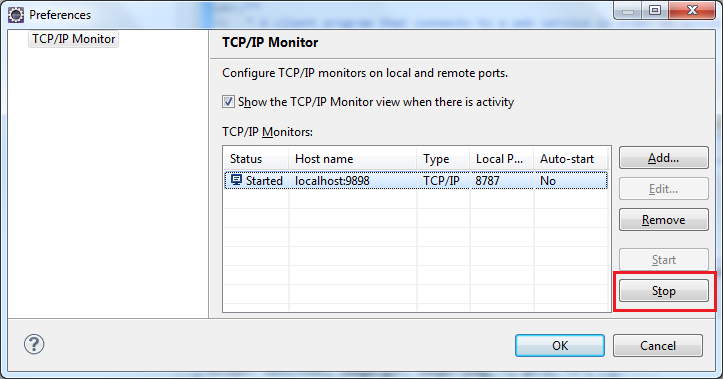 ConclusionSo far we have demonstrated how to use the TCP/IP monitor in Eclipse IDE to watch the client-server communications in general as well as analyzing SOAP messages in cases of web services applications, and see that it’s pretty easy to use. But remember to change the server port number in the client code after using the monitor.
 Other Java Web Services Tutorial:
- Java Client Server Web Services (JAX-WS) Tutorial
- Java Web Services Tutorial using Apache Axis2, Ant and Tomcat
- Java Web Services Binary Data Transfer Example (base64 encoding)
- Using MTOM to optimize binary data transfer with JAX-WS web services
- Java RESTful Web Services Tutorial for Beginner with Jersey and Tomcat
- How to code and deploy Java XML Web Services (JAX-WS) on Tomcat
- Java CRUD RESTful Web Services Examples with Jersey and Tomcat
About the Author:
 Nam Ha Minh is certified Java programmer (SCJP and SCWCD). He began programming with Java back in the days of Java 1.4 and has been passionate about it ever since. You can connect with him on Facebook and watch his Java videos on YouTube.
Comments